The Genesis SRC Entry observing campaign was only partially successful, because the pointed spectrographs and high-speed imagers were aimed ahead of the speeding capsule in the bright daytime sky due to an error in pointing instructions. Fortunately, the next Stardust SRC Entry will be a night time event, providing a star background coordinate system, early detection when the SRC Entry is still faint, and the ability to work with widefield tracking cameras. Below are some of the results we obtained from staring instruments during the Genesis mission.

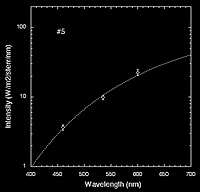
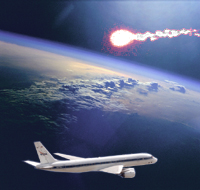
Fig. 1: Sequence of still images of the *daytime* Genesis SRC entry.
Fig. 2 (right): Blackbody curve plotted through intensity measurements in blue, green, and red fields of the digitial images
Change of surface temperature
A digital camera was used by Paul Wercinski of NASA Ames to record the Genesis SRC in the final part of the trajectory, following the capsule to a much larger angle out of the aircraft windows than could be reached by other cameras. By keeping the images slightly out of focus, the light is spread over many pixels and did not saturate the camera. Each picture provides a brightness in a wavelength range typical for "blue", "green", and "red" response. As a result, the color of the light can be used to measure the brightness temperature (Figure 2). Due to a lack of shock emissions, this temperature is expected to be close to the average surface temperature of the sample return capsule.
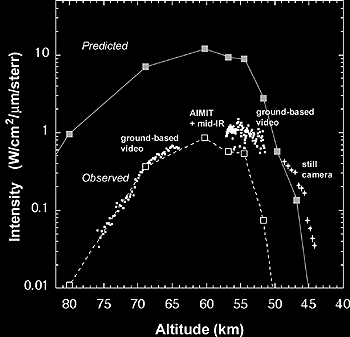
Fig. 3: Compilation of brightness measurements
Peak temperature
Figure 3 shows a compilation of the surface-averaged brightness of the Sample Return Capsule Entry as measured by different staring instruments onboard the aircraft and as recorded by ground-based video by two teams: Wesley Swift and Rob Suggs (MSFC), and Don Hladiuk and Alan Hildebrand (Univ. of Calgary). The predicted peak temperature of about 2,640 K (averaged over the exposed surface area) is 440 K above that observed (T = 2,200 K). The early parts of the trajectory are cooler by about 570 K. In later parts, the surface cooled less rapidly than predicted. These discrepancies are possibly because in this particular prediction the surface was assumed not to be able to hold on to the heat, nor to be ablating. Much of the heat penetrates into the heat shield and surface ablation will cool the surface.
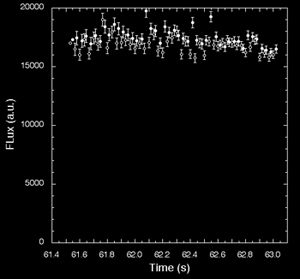
Fig. 4: Genesis SRC entry at 960 nm wavelength. The halo is an instrumental artifact.
Fig. 5 (right): Intensity of SRC entry at 960 nm
Intensity fluctuations
The AIMIT tracker of Peter Jenniskens of the SETI Institute (Fig. 4), as well as a mid-Infrared camera analysed by George Rossano of the Aerospace Corporation, captured the Genesis SRC Entry in a corner of the field. From these video records, we studied the fluctuation of capsule brightness at the point of peak heating, only to find that the light was very stable in intensity. This is consistent with the contribution from shock emission being small in this wavelength regime and there was no significant tumbling of the capsule in this part of the flight.
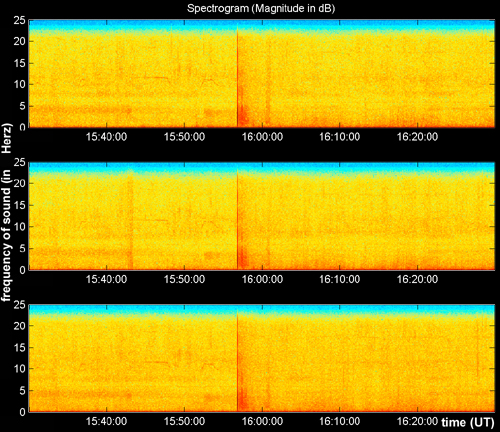
Fig. 6: Accoustic signal detected by three sensors at Wendover, NV.
Infrasound
About a minute after passing of the SRC, the sound wave from the bow shock was detected on the ground as a distant rumble by the three infrasound detectors deployed in Wendover, NV, by Doug Revelle of Los Alamos National Laboratories. The acoustic signal could be detected over two minutes after the sonic boom arrived. This spectrogram (Fig. 6) shows the frequency in Hz versus time after the initial hypersonic boom arrived, with contoured power levels in color (red is the strongest). Note the second signal after ~2 minutes which is the weaker reflection of sound signals from a nearby mountain range. The distant rumble was also heard by observers on the ground and loud enough to be audible in the video by Don Hladiuk. This measurement served to calibrate the infrasound signal of natural bolides, providing a known mass and speed. The detected signal was only a factor of two stronger than expected, possibly because of slightly different ground reflection properties than assumed. A paper was published in Meteoritics and Planetary Science.
[Results from the Stardust mission]